01JUN 2024
BUILD FORCE
Started training to dunk. Squat 1RM began near 40 kg; approach vertical was roughly 70 cm.
SplitLab is my personal study of how sprint training, athletic development, recovery, and statistics shape performance on the track.
I began with basketball and one concrete goal: dunk. The path from the weight room to plyometrics to sprinting changed both what I trained and what I measured.
Started training to dunk. Squat 1RM began near 40 kg; approach vertical was roughly 70 cm.
Shifted from mostly strength work to 1–2 high-intent plyometric sessions each week.
Ran an electronically timed 4.60-second 40-yard dash—the second-fastest mark on the varsity basketball team.
Opened my first track season with an official, electronically timed 12.30-second 100 meters.
A PCL injury paused the timeline and widened the question from performance to movement quality.
Resumed full-speed sprinting. Flying 10m improved from 1.10 to 1.00 seconds.
Raced an officially timed 11.45-second 100 meters—the latest competition benchmark for SplitLab.
When does a better result mean I truly “leveled up”—and when is it just noise?
My largest jump improvement coincided with a shift from primarily building strength to high-intent plyometric work. That timing is meaningful—but it is not proof that one change caused the result.
These jump milestones are retrospective estimates, not standardized lab measurements. Standing and approach jumps are kept separate.
Back and front squats, RFESS, step-ups, leg press, hip thrusts · about 2 lower-body sessions/week.
Depth jumps, drop-to-broad jumps, pogo jumps, bounds, hurdle hops, seated and kneeling jumps · 1–2 sessions/week.
Training history, not a recommendation. Load, maturation, technique, and measurement conditions changed together.
An electronically timed team assessment put a new possibility on the clock.
40-yard dash · second-fastest on the varsity basketball team
First electronically timed 100m race
Current electronically timed competition result
Electronic timing · ten months apart
Timing is consistent; run-in distance and conditions were not fully documented, so the comparison still carries uncertainty.
Practice footage adds context that a results table cannot: the surface, environment, repetition, and intent behind each measured outcome.
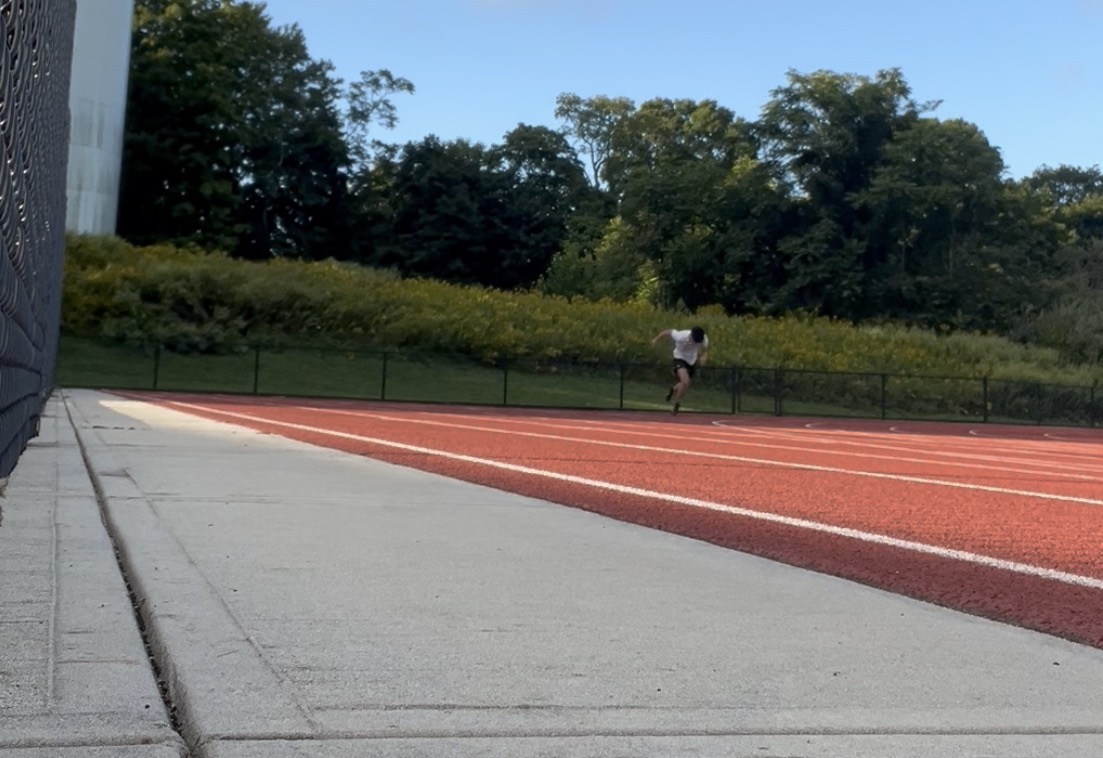
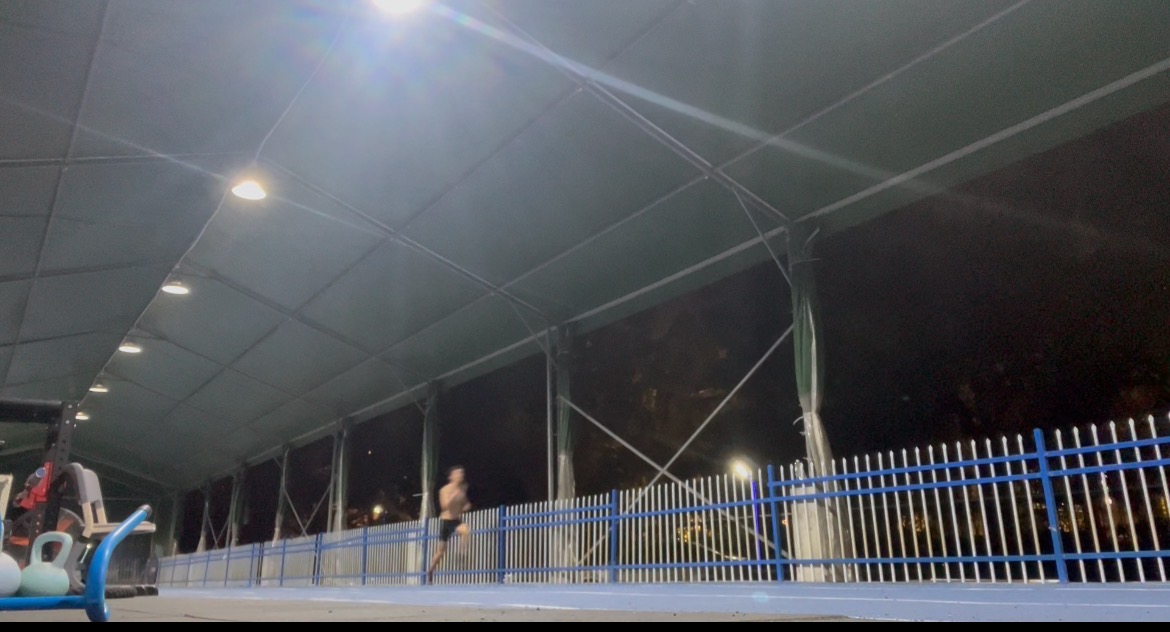
Training images document the process; official competition timing remains the performance standard.
When a PCL injury interrupted my first track season, I worried that years of strength and explosiveness would disappear—and that running in college would move further away.
Rehabilitation widened my definition of performance. Work on foot stability and big-toe strength, hip mobility, and anterior–posterior chain balance made movement quality visible before it appeared on a stopwatch.
Recovery became more than a return to baseline. It exposed what my original dataset had missed.This is a personal reflection, not medical guidance or a causal claim.
Enter at least six repeated measurements from the same test. This simple tool compares your early and recent averages with the variation across all trials.
Keep equipment, warm-up, surface, and timing method consistent. This is an exploratory check—not proof of improvement.
A personal best is one observation. Statistics asks what generated it, how variable the process is, and whether the result will repeat.
Electronic timing, remembered jump heights, run-in distance, surface, and warm-up do not carry equal precision. I label them differently instead of treating every number as interchangeable.
Repeated tests create a personal distribution. The mean and sample standard deviation describe normal performance better than one best attempt.
The shift from strength-first training to plyometrics is a candidate change point—not automatic evidence that plyometrics alone caused the faster improvement.
The 11.45 official race is the current competition benchmark; future races will test how reliably that level holds.
The 11.45-second 100m is labeled as a competition result, distinct from training tests.
Recalled jump milestones use ≈ and remain separate from standardized measurements.
No 30m result is invented. Missing setup details remain documented as limitations.
Training changes coincided with progress, but this single-athlete observational history cannot establish causation.